Optimal Haul Export
Updated May 06, 2025
This article applies to:
- Softree Optimal
The Optimal Haul graphic (previous exercise) and hover tips (tooltips) are useful while you are designing but you will also need to generate numeric reports. The following example will export all the information contained in the Optimal Haul diagram into a spreadsheet.
- Open Location Module
 .
.
- File | Open. Select Hart Rd optimal haul.dsnx. Press Open.
- Maximize
 the Profile window, ensure the Alignment Properties panel is visible.
 - Export the Optimal Haul data:
-
- Right click in the Optimal Haul diagram window and choose menu Copy Opti Haul to Clipboard. (Alternately, use menu File | Save As to save a Haul Table (*.csv) file).
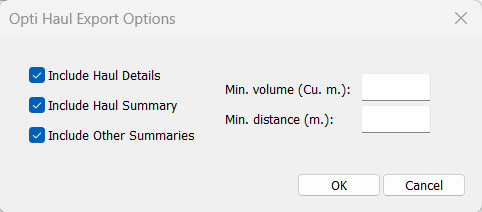
Figure 1: Optimal Haul export options.
-
- When prompted with the Optimal Haul Export Options dialogue box, select all three options as in the dialogue above.
- Other Summaries include:
- Cost summary,
- Volume summary,
- Pit summary,
- Movement summary.
- Haul Details include:
- Movement details,
- Pit details.
- Haul Summary include:
- Detailed movement summary.
- Other Summaries include:
- Press OK to continue.
- When prompted with the Optimal Haul Export Options dialogue box, select all three options as in the dialogue above.
- Open a spreadsheet program (such as Microsoft Excel) and paste.
The first few rows of the spreadsheet contain summary information. This is slightly more detailed than the information area of the alignment panel.
Cost Summary
| Cost summary | |||||
|---|---|---|---|---|---|
| Haul | Cut | Fill | Pit Opening | ||
| Total | 34551.89 | 384040.47 | 56386.42 | 0 | |
| GR | 13717.69 | 68376.73 | 24450.16 | ||
| SR | 20834.2 | 315663.74 | 31936.27 | ||
Table 1: Optimal haul output excerpt: cost summary.
The total costs are available in the information area of the alignment panel; however, this table breaks the costs down by material. Site Preparation cost is the sum for all opened pits.
Volume Summary
| Volume summary | |||||||
|---|---|---|---|---|---|---|---|
| Cut | Borrow | Underflow | Fill | Waste | Overflow | Sidecast | |
| GR | 17094.18 | 0 | 0 | -12225.08 | -4869.11 | 0 | 0 |
| SR | 14943.54 | 2798.83 | 0 | -17742.37 | 0 | 0 | 0 |
| OB | 0 | 0 | 0 | 0 | 0 | 0 | 0 |
Table 2: Optimal haul output excerpt: volume summary.
This table reports all the categories of material sources (positive) and uses or disposal (negative). The sum of each of the materials is zero; this indicates conservation of mass.
- Cut: excavation from the road-bed.
- Borrow: material from a user defined pit.
- Underflow: material from a system defined pit of last resort.
- Fill: embankment in the road-bed.
- Waste: disposal to a user defined pit.
- Overflow: disposal to a system defined pit of last resort.
- Sidecast: disposal along the road corridor directly opposite to the excavation (not a pit).
Pit Summary
| Pit summary | |||
|---|---|---|---|
| Pit1 | Pit2 | Pit3 | |
| Station number | 0 | 0 | 450 |
| Distance | 0 | 0 | 2500 |
| GR | -4869.11 | 0 | 0 |
| SR | 0 | 0 | 2798.83 |
| OB | 0 | 0 | 0 |
Table 3: Optimal haul output excerpt: pit summary.
This table contains total volumes of material extracted from pits (positive) and deposited into pits (negative). If you would like to see how the material was moved to/from the pit, scroll down to the Pit details section at the bottom of the spreadsheet.
Movement Summary
| Movement summary | ||||||
|---|---|---|---|---|---|---|
| Cut | Pit Load | Station Unload (movement) | Pit Unload | Same Station Unload (no movement) | Sidecast (no movement) | |
| GR | 17094.18 | 0 | -9180.25 | -4869.11 | -3044.82 | 0 |
| SR | 14943.54 | 2798.83 | -17742.37 | 0 | 0 | 0 |
| OB | 0 | 0 | 0 | 0 | 0 | 0 |
Table 4: Optimal haul output excerpt: movement summary.
This table reports total volumes of material moved. Rather than define all possible movement types (pit to road, road to road, road to sidecast, etc.) we define load (positive) and unload (negative). Material is handled by earthmoving equipment; the equipment loads material, moves it somewhere, and unloads it.
Again, the sum of each of the rows is zero.
A Movement Model
In the spreadsheet follows the detailed movement information for stations (Movement details section) and pits (Pit details section). In order to understand this section (and the movement summary above), consider material movement as a series of six conveyor belts which move material forwards and backwards as below:

Figure 2: Schematic of material movement via conveyor belts.
The Freehaul conveyors handle short hauls (perhaps representing bulldozers); the Overhaul conveyors handle medium hauls (perhaps representing scrapers); the Endhaul conveyors handle long hauls (perhaps representing trucks and shovels).
The optimal haul calculation works from cross-sectional areas at sampled stations; to generate volumes, it creates a segment for each sampled station.
Internal movement
The schematic above includes material movements within the road corridor (we call this internal movement). Material excavated within a segment can be:
- Placed in the same segment (zero distance).
- Sidecast (zero distance).
- Loaded to one of the six conveyors.
The conveyor used depends on the distance and the direction the material needs to travel. Embanked material must be unloaded from a conveyor or come from the same segment.
External movement
The schematic does not include external movement but it is not hard to imagine:
- Borrow pits can load material to a conveyor.
- Waste pits can unload material from a conveyor.
Multiple material and balance
All excavated material (from pit or road-bed) must be placed somewhere (to road-bed, pit or sidecast); the quantities must balance. This is true for each of the materials individually.
Detailed movement summary
The spreadsheet finishes by a detailed movement summary, which compounds the information contained in the movement model, in a more usable format.
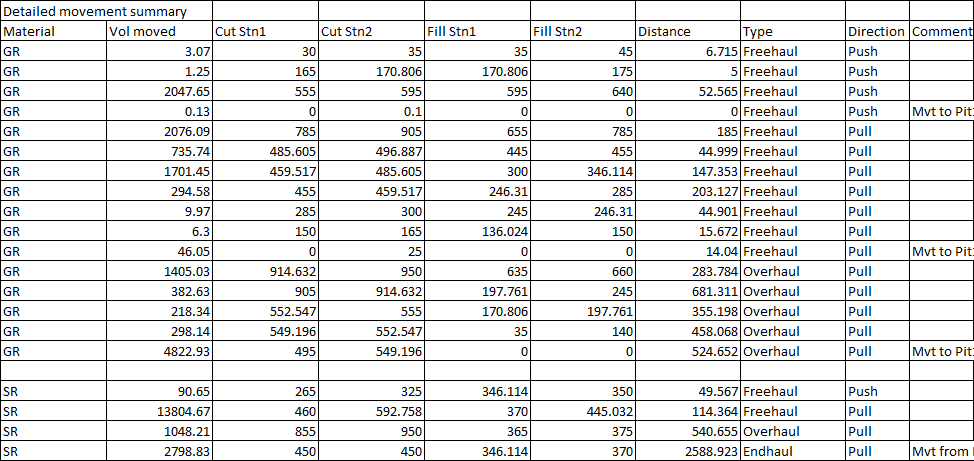
Table 5: Optimal haul output excerpt: detailed movement summary.
Note: The detailed movement summary is presented with same format as the Mass Haul balance items (Right click on the Mass Haul diagram and select Copy Mass Haul balance items to Clipboard).
- File | Exit. Do not save changes.