Viewing Curve Transitions
Updated August 22, 2024
This article applies to:
- RoadEng Civil
- RoadEng Forestry
This Knowledge Base article is an excerpt from one of our tutorial files. The files referenced in the article, as well as the full tutorial document, are available in our Tutorial Installer.
Now we will look more closely at the curves we have created to see how the super elevation is applied along the alignment.
 File| Open to open <RoadEngCivil>\Location\Align stage 4.dsnx in Location Module.
Use the Screen Layouts tool bar control to retrieve <Defaults and Layouts>\training\training Curve H.dlt.
Use the next
 or back
  buttons in the windows tool bar (NOT in the curve panel) to move the current point to the tangent before the first curve (figure below).

Figure 1: Section Window Text Area Depicts Super-Elevation While the Plan Window has a Curve Transition Report Points Displaying (Green Tick)
Cross sections are calculated at all the horizontal curve transition points (unless you explicitly turn off this feature). In this screen layout, these points have been given a green tick symbol so you can see them in the plan window.

Figure 2: Plan Window Curve Transition Report Points Displayed (Green Tick)
Use the next
 or back
  buttons in to move the current point to the first (South most) tick. Note that the cross section shows full crown with super slope of 2% (Super L = -2.0%, Super R = -2.0%).
Click the next
 button and watch the section window. Continue clicking the next
  button. The outside (right) cross fall is increasing. Stop when you get to the next tick mark.
The second tick mark is the end of tangent runout and the beginning of super-elevation runoff. The right hand cross-fall is 0.0%. Note that the station is 133.3 ft less than the BC station – 2/3 of our transition length.
Continue clicking the next
 button until you get to the next tick mark. The outside lane has rotated until it is tangent to the crown slope on the other side (Super L = -2.0%, Super R = +2.0%). From here on both sides will rotate.
Continue clicking the next
 button until you get to the BC point. Here the super-elevation is about 4% (2/3 of the final value).
Continue clicking the next
 button until you get to next tick mark. This is full super-elevation.
Use the horizontal curve panel to change the Transition Fraction to 0.5 and re-apply the curve. Note how transition points move.
Curve Transition Overlap
What happens between the two curves?
Use the same technique to step through the cross sections near the tangent between the two curves.
Note: When there is not enough distance between curves for the full transition, the software will skip the crown cross sections and go directly from one super-elevation to the other (with one flat cross section in between in the case of an S curve).
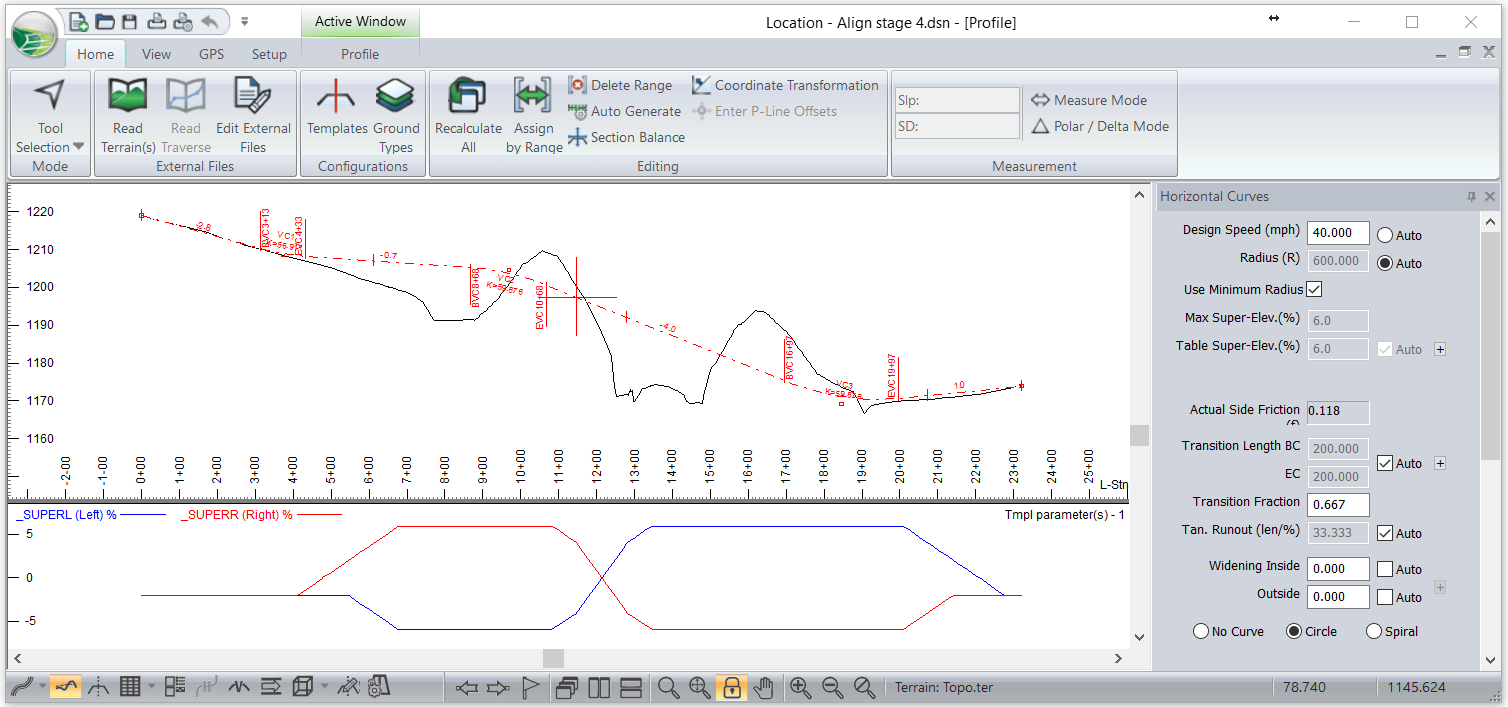
Bring the Profile window to the front, the sub-window has been configured to show the super elevation (refer to figure next page).
In order to get the graph to display you need to recalculate all: Home | Recalculate All. The recalculate range dialogue box comes up. Select Update entire design and press OK.

Figure 3: Re-calculate Range Dialogue Box.

Figure 4: Profile Template Parameters Sub-Window
with Super Elevation Displayed.
If time permits, move the curves closer or farther apart and repeat your cross-section audit.
The super elevation graph is useful to view transition of super elevation. To display graph: right click… in profile window | Profile Options…. | Select… button | select Tmpl parameter(s) – 1
 File | Close. Do not save changes.